
By MyAutoResource Editorial Team · Reviewed by Steven Sun · 5 min read · Updated July 13, 2026
- Two used cars at the same $28,000 price can differ by more than $1,000 in five-year ownership cost, and the sticker price hides all of it.
- Depreciation, the value a car loses over time, is usually the single biggest cost of ownership, larger than fuel or repairs.
- You can estimate fuel cost for your exact commute free on the government’s fueleconomy.gov, and depreciation on KBB’s 5-Year Cost to Own tool.
- The cheaper car to buy is not always the cheaper car to own. Run all four costs before you decide.
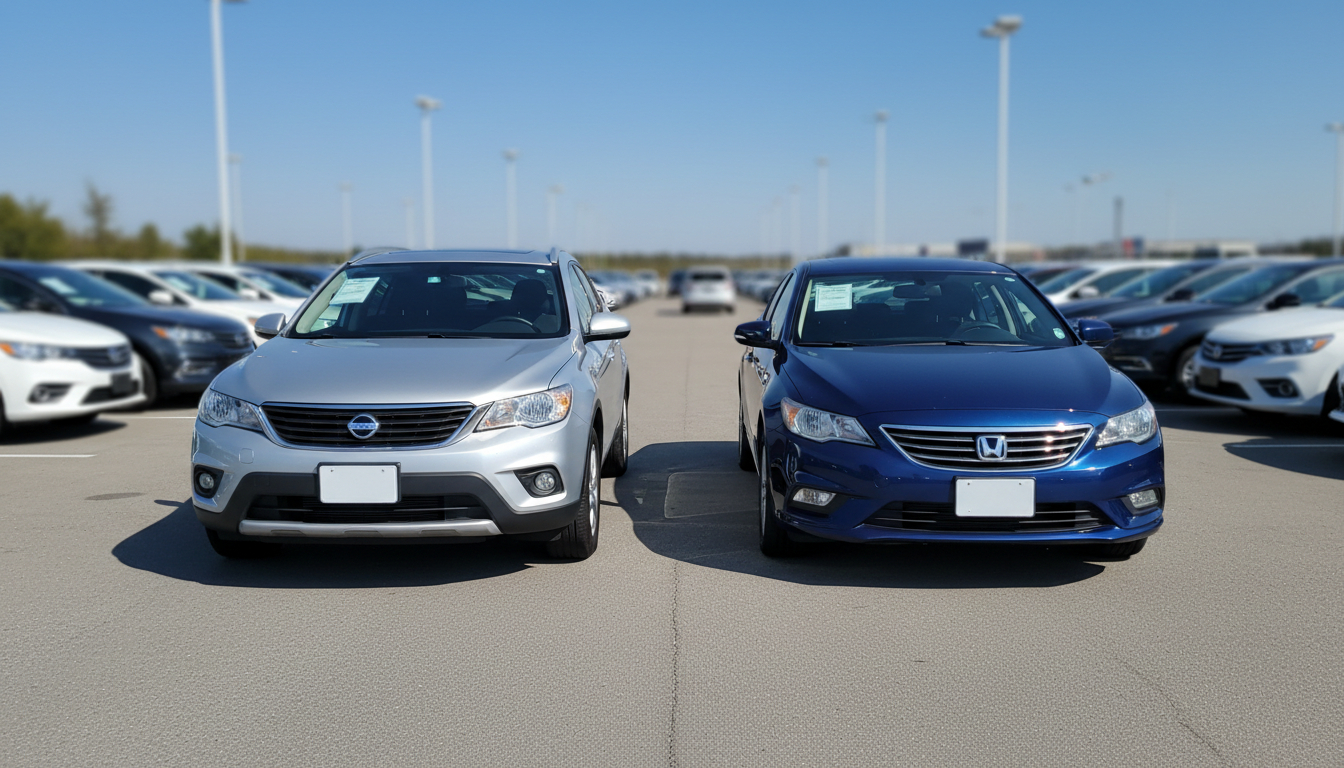
Priya narrowed her search to two used cars at the same $28,000 price: a compact SUV and a midsize sedan. On the lot, they felt like a coin flip. Over five years of ownership, one of them costs about $1,200 more to own, and the sticker price is not where that gap shows up. The price on the windshield is only the first payment on the real cost of a car.
The four costs that decide which car is cheaper to own
Every car costs you in four main ways after you buy it. The biggest is usually depreciation, which is the value the car loses as it ages. If you buy at $28,000 and the car is worth $13,000 in five years, depreciation cost you $15,000, whether or not you ever notice it. It shows up only when you sell or trade.
The other three are fuel, maintenance and repairs, and insurance. None of these appear on the price tag, and they can easily add up to more than the purchase price over a few years. Two cars with the same sticker can land far apart once you add all four together.
Run the fuel numbers for your exact driving
Fuel is the easiest cost to estimate and often the biggest swing between two cars. The key figure is combined miles per gallon, or MPG, which blends city and highway driving. A car rated at 33 MPG uses far less gas than one rated at 26 MPG over the same miles.
The Environmental Protection Agency’s fueleconomy.gov tool lets you estimate annual fuel cost for a specific model based on how much you drive. Over 60,000 miles at about $3.30 a gallon, a 26 MPG SUV burns roughly $7,600 in gas, while a 33 MPG sedan burns about $6,000. That is a $1,600 difference from fuel alone before you count anything else.
Build the five-year picture
Here is Priya’s two cars side by side, using rounded estimates for a driver covering 60,000 miles over five years. Your figures will differ, but the shape of the comparison is what matters.
| Cost over 5 years | Compact SUV | Midsize sedan |
|---|---|---|
| Fuel (60,000 miles) | $7,600 | $6,000 |
| Maintenance and repairs | $4,500 | $4,000 |
| Insurance | $7,500 | $7,000 |
| Depreciation | $14,000 | $15,400 |
| Five-year total | $33,600 | $32,400 |
| Best for | Cargo, weather, higher resale value | Lower running cost, better mileage |
The sedan wins by about $1,200 overall, mostly on fuel, even though the SUV holds its value slightly better. Notice that depreciation is the largest line for both cars, which is why resale value matters as much as gas mileage. For depreciation, KBB’s car value tools estimate a model’s 5-Year Cost to Own, so you can plug in your two finalists instead of guessing.

How to do this for your own shortlist
You can build this same comparison in about fifteen minutes. First, look up combined MPG and annual fuel cost for each model on fueleconomy.gov using your real yearly mileage. Second, pull each model’s projected depreciation or 5-Year Cost to Own from KBB. Third, get a quick insurance quote for each car, since rates vary by model, not just by driver. Add the four numbers for each car and compare the totals. In fact, even two trims of the same nameplate can carry very different theft-claim risk, so a VIN-specific insurance quote is worth getting before you buy, not after.
Then close the loop the same way you would with any used car: get a pre-purchase inspection before you commit, and if you are torn between two specific listings, compare them line by line rather than by gut feel. The winner on the lot and the winner over five years are often two different cars.
Frequently asked questions
What is the biggest cost of owning a car? For most cars it is depreciation, the value the car loses over time. On a $28,000 car, depreciation can total $14,000 to $16,000 over five years, more than fuel and repairs combined. It is invisible until you sell or trade, which is why buyers underestimate it.
How do I compare fuel costs between two cars? Look up each car’s combined MPG on fueleconomy.gov, then multiply your yearly mileage by the fuel cost the tool estimates. A gap of even 5 to 7 MPG can add up to more than $1,000 over five years of typical driving.
Is a cheaper car always cheaper to own? No. A lower purchase price can be erased by worse fuel economy, faster depreciation, or higher insurance. The only way to know is to add all four ownership costs, not just compare stickers. That math looks different for a used EV specifically now that the federal tax credit is gone: see the real payback math on a used electric vehicle versus a comparable gas car.
Does insurance really differ between two similar cars? Yes. Insurers price by the specific model based on repair costs, theft rates, and claim history, so two cars at the same price can carry different premiums. Always get a quote for each finalist before you decide.